Results you can measure. Performance you can trust.
Verified, management-approved results from our 2026 KPI Performance Dashboard, covering education and training programs and 25 years of program and project management.
Education, professional development & training performance.
Our 2026 KPI Performance Dashboard reports multi-year results across Captivate’s education, professional development, and training programs. It covers 74 programs serving more than 10,000 participants in six states and the District of Columbia. It tracks learning and completion, workforce placement and retention, delivery quality, equity, and partner satisfaction against targets and industry benchmarks.
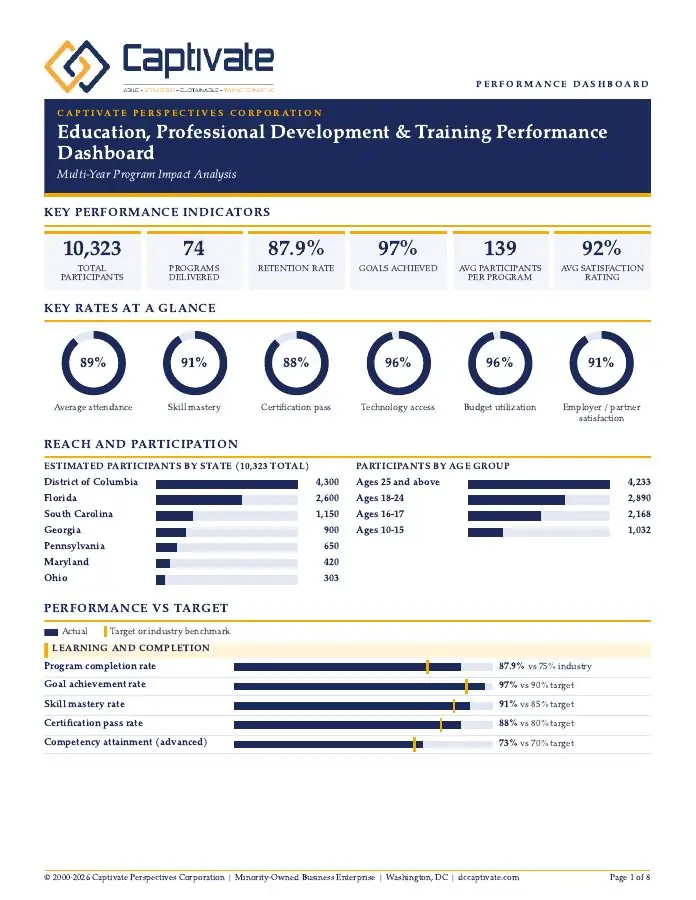
Results across 74 programs and 10,323 participants.
Cumulative performance reported in the 2026 KPI Performance Dashboard, compared with program targets and industry benchmarks.
Learning performance vs target
Actual vs target or industry benchmark, %
Workforce outcomes
Placement, retention, and advancement vs target, %
Estimated participants by state
Estimated allocation of 10,323 participants
Participants by age group
Share of 10,323 participants
Delivery quality, equity, and partnership
Actual vs target or industry benchmark, %
Company-reported cumulative figures from the 2026 KPI Performance Dashboard. State-level participant counts are estimates. Workforce outcomes are based on the subset of participants eligible for employment services (about 40% of total). Industry benchmarks are shown for comparison only.
A portfolio of 140 projects delivered over 25 years.
Value created for clients and the portfolio
Dollars in millions
Key rates at a glance
Portfolio rates, %
Project performance vs target or industry
Delivery, client experience, and technology implementation, %
Company-reported portfolio figures from the 2026 KPI Performance Dashboard, 2000 to present. Industry benchmarks are shown for comparison only.